

Info-graphics or Information graphics are a visual way to represent information, knowledge, and data in a clear and concise way. They catch the audiences attention through compelling images that represent the information to be presented.
I find that I would use info-graphics in the classroom for sure. I would use them just as posters on walls or in online classroom blogs. I think they are a great way to get a students attention on the fundamental concepts and ideas for any area. I think info-graphics are much more useful for interesting, but difficult, concepts that aren't easily understandable. For example, in the physics of bottle flipping. The science behind bottle flipping is so complex that only an info graphic would suffice for explanation.

Assessment ideas:
1. If I were teaching in a science classroom, I would introduce an infrographic on a certain topic, say planets and the universe. Once students have had some time to view the graphic, I would prompt students to pick an aspect of infographic and research it in more depth. Then the students would have to deliver some sort of submission about their research. It could be a paper, project, model, etc.
2. Get the students to make an infographic of their choice! To create an infographic that explains a concept takes alot of effort. There needs to be plenty of synthesis of the material in order to choose which information is important. Also, finding an appropriate image requires another sensory dimension that would help students build better understand.
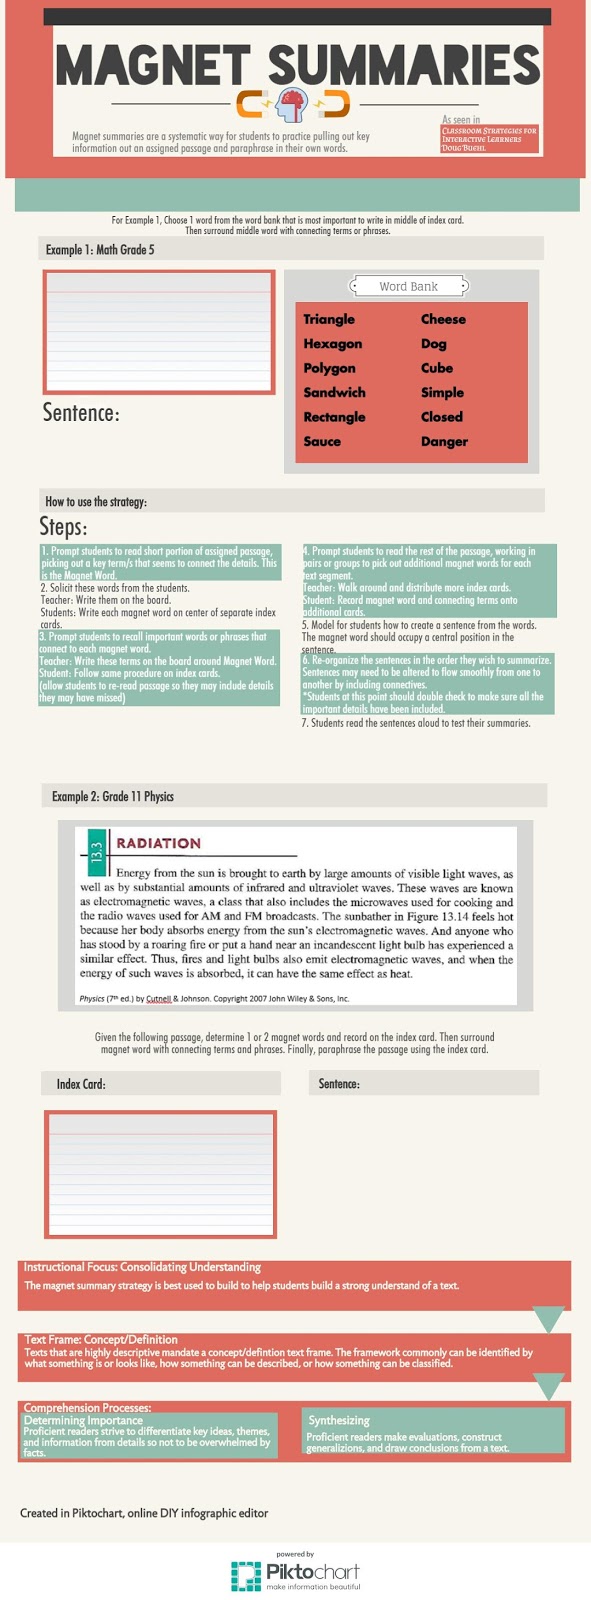
One info-graphic that I had made for an assignment in education was about a comprehension strategy I had to present to the rest of my class. The strategy is Magnet Summaries. I think it helped with class engagement and made for useful hand-out as well.
No comments:
Post a Comment